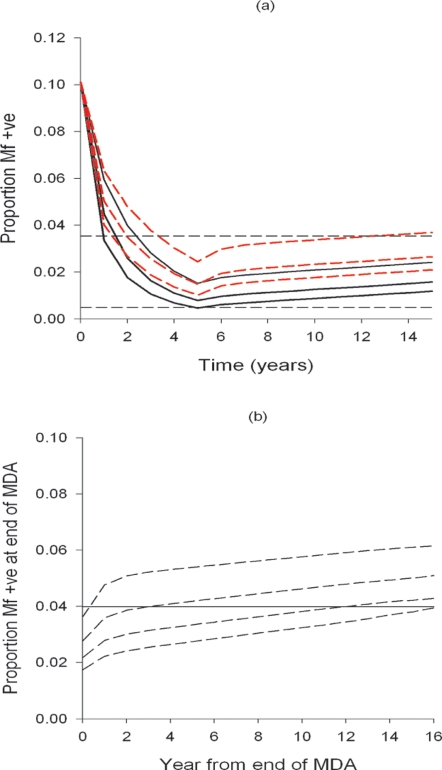
Figure 2.
(A) Simulation results showing annual changes in overall community mf prevalence (scaled to 1 ml blood sampling volume) predicted by a deterministic model for filariasis transmission following a 5-year annual intervention programme with either the DEC/ALB (solid lines) or IVM/ALB (dashed lines) drug regimen. Initial community mf prevalence was set at 10%, and for each regimen predictions are shown for treatment coverages of 65%, 80% and 95% (portrayed by curves going from top to bottom respectively for each regimen). Upper horizontal dashed line shows the disease control mf threshold of 3.55%, while the lower line depicts the parasite elimination threshold of 0.5% mf prevalence. All figures are given at the scale of 1 ml blood sampling volume. Drug efficacy values are as given the text. (B) Numerical projections (dashed curves) of changes in LF infection prevalence (Mf % at 1 ml blood sampling scale) following different levels of reduction from initial equilibrium infection prevalence induced by annual MDA, as predicted by the EPIFIL model. Note that the greater the reduction of initial prevalence to below the mean disease threshold of 3.55% mf prevalence (solid horizontal line), the longer it will take to rebound to this threshold. For example, a reduction to a mf prevalence of 2.175% following annual MDA (second dashed curve from the bottom) will take up to 12 years to rebound to the disease incidence threshold.

