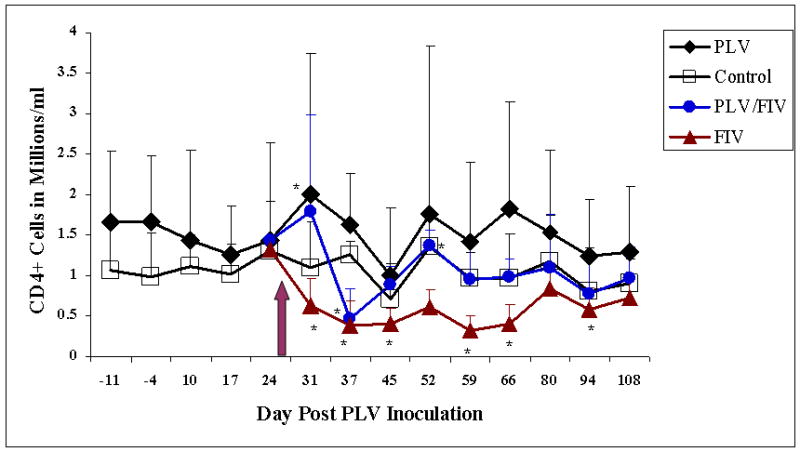
Figure 2.

Mean CD4-positive T-Cell counts in groups inoculated with PLV or medium only on day 0. Solid diamonds represent the PLV-inoculated group and open boxes represent the medium-inoculated controls. Arrow indicates inoculation of 5 animals from each group with FIV or diluent. Solid triangles represent the single virus inoculated group (FIV only) and shaded circles represent the dual virus inoculated group. Asterisks indicate a statistically significant difference (p≤0.05) from baseline values.
