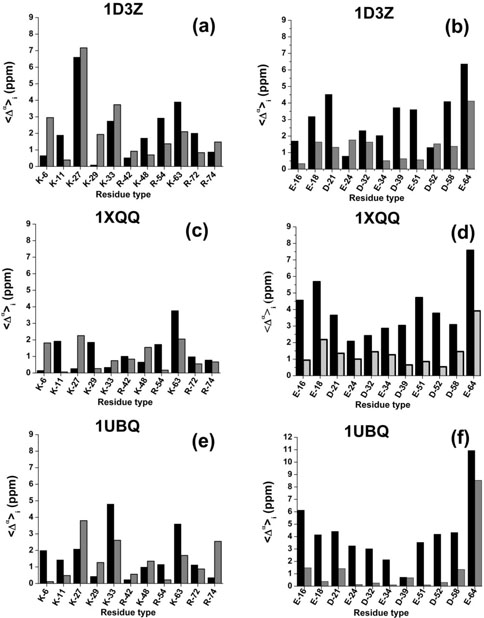
Figure 3.
Black and grey filled bars denote an average, over all conformations, of the computed error , given by Eq. (4), assuming charged and neutral side chain, respectively. The results are grouped in panels for each set of conformations used during the calculations. Thus, for basic and acidic groups, respectively, obtained with conformations of: 1D3Z, are shown in panels (a,b), 1XQQ, are shown in panels (c,d), and 1UBQ, are shown in panels (e,f).

