
Figure 6.
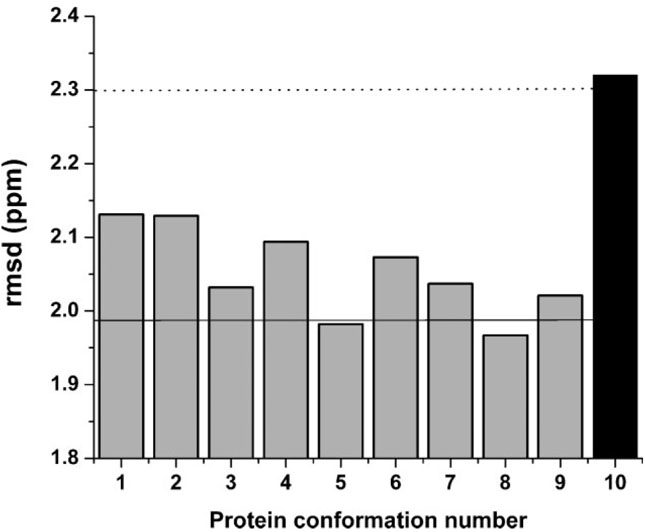
Grey bars indicate the rmsd value computed as described in the Methods section for each member of the set of 9 new conformations of ubiquitin (see section Computation of the Chemical Shift error, , and the Conformationally-Averaged Root-Mean-Square-Deviation (ca-rmsd). The Black bar indicates the rmsd value (2.32 ppm) computed for Model 1 of 1D3Z, from which the set of nine new conformations was derived. The horizontal dotted line (2.30 ppm) represents the ca-rmsd computed for the 10 conformations of 1D3Z.1 The solid horizontal line (1.99 ppm) indicates the ca-rmsd value computed for the set of 9 new conformations (as explained in section Analysis of the Effects of Side-Chain Conformation on the 13Cα Chemical Shifts in Results and Discussion).