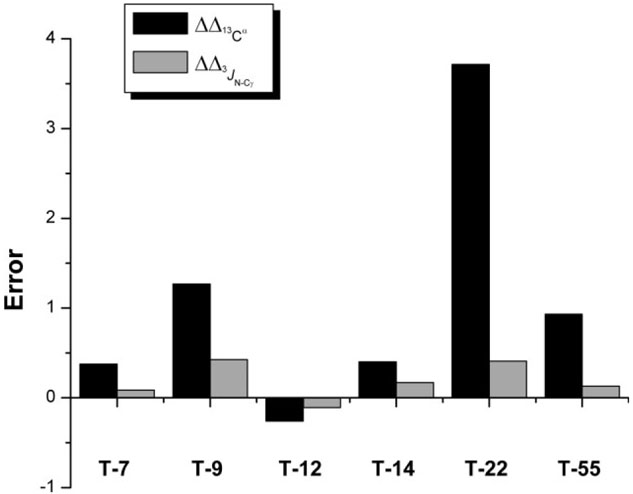
Figure 8.

Black and Grey filled bars, respectively, indicate the value of the nn being the number of threonine residues in the sequence, m_1 means “from Model 1 of 1D3Z” and new_set means “from the average value of the set of nine new conformations.”
