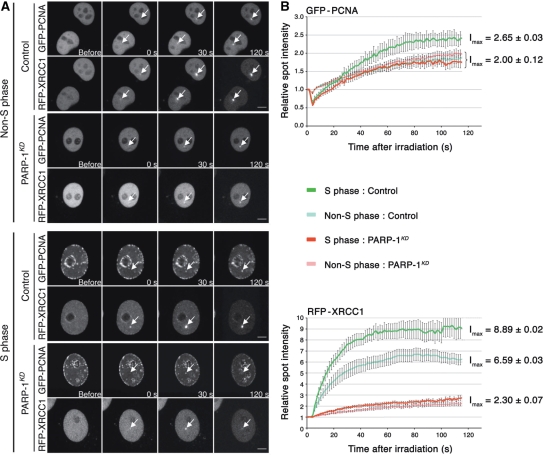
Figure 5.
Analysis of XRCC1 and PCNA recruitment at DNA damage sites in cells expressing (control) or lacking PARP-1 (PARP-1KD). (A) Live cell imaging of microirradiated control and PARP-1KD cells expressing RFP-XRCC1 and GFP-PCNA proteins. Cells were transfected with both plasmids 48 h before the experiments. To evaluate the recruitment of these proteins to DNA damage sites, a time-course analysis from to 0 to 120 s was performed. The distribution of PCNA foci was used to determine the cell cycle phase (S or non-S phase) of each cell analyzed, according to Mortusewicz et al. (20). Scale bar (lower right), 5 µm. (B) Quantitative time-lapse analysis of RFP-XRCC1 and GFP-PCNA recruitment at sites of microirradiation in control and PARP-1KD in S or non-S phase. The relative spot intensity was calculated as described under Materials and methods section. Each value represents the mean fluorescence intensity from an average over 10 cells. Bars, SEM. Data points were fitted to an exponential equation to calculate the maximum fluorescence intensities (Imax) at the plateau of the reaction.

