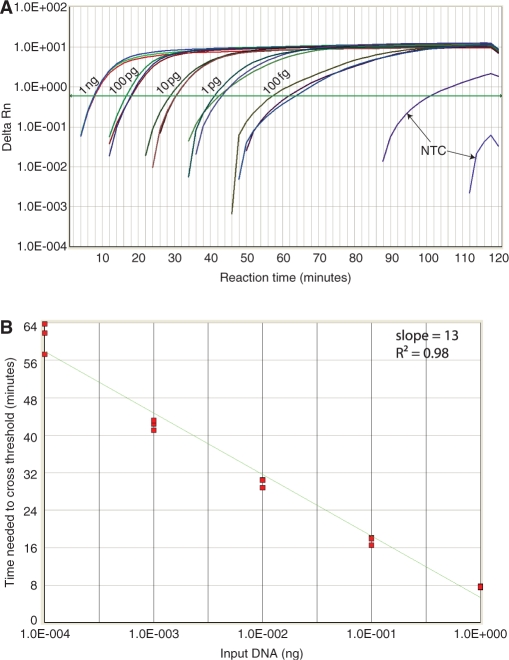
Figure 6.
Real-time quantitative pWGA. (A) Real-time amplification signal (Delta Rn) from triplets of 0 (NTC), 100 fg, 1 pg, 10 pg, 100 pg and 1 ng of input DNA is plotted against reaction time. The threshold is drawn as a green line. (B) Ct number from different amount of input template is plotted against the amount of input template with a linear fit shown as a green line. The slope and the goodness of fit (R2-value) are shown at the top right of the plot. The template amount on the x-axis is distributed on a log scale.

