Figure 6.
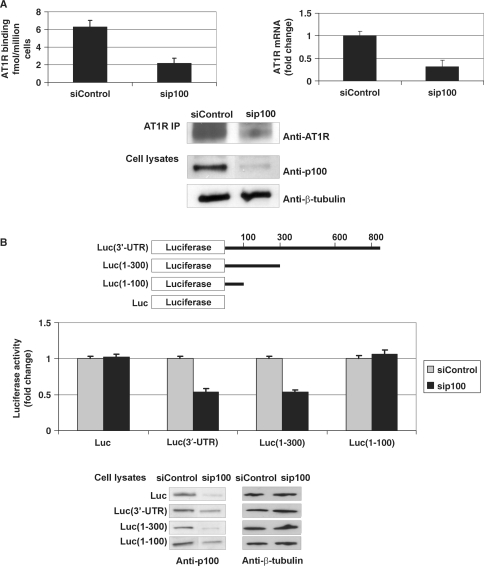
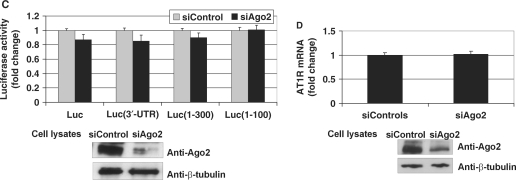
Silencing of p100 expression decreases AT1R expression. (A) The effect of p100 silencing on AT1R expression in VSMCs. VSMCs were transfected with 30 nM siRNA for p100 (sip100) or equal amount of control siRNA (siControl). AT1R expression was then quantified by ligand binding (left column). Transfected VSMCs were also subjected to RNA extraction, followed by RT–PCR and quantitative AT1R-PCR (right column). Results are shown as a mean of three independent experiments and SD. The mean mRNA value of siControl-transfected cells was set to one. Endogenous AT1R was immunoprecipitated from VSMCs and detected by western blotting (upper panel). The expression levels of p100 and β-tubulin in VSMC lysates are also shown (lowest two panels). (B) Silencing of p100 reduces the activity of Luc(3′-UTR) and Luc(1–300) constructs. A schematic representation of different luciferase constructs used is shown. COS-1 cells were transfected with luciferase constructs with or without regions of 3′-UTR, as indicated, and co-transfected with 30 nM sip100 or siControl, together with plasmid expressing renilla luciferase. Cells were lysed and assayed for firefly and renilla luciferase activities. Results are shown as a mean of three independent experiments and SD. The mean value of each luciferase construct transfected together with siControl was set to one. Below are the western blots demonstrating the efficiency of the silencing of p100 (left panels) and β-tubulin control blots (right panels). (C) Silencing of Ago2 expression has no effect on luciferase constructs. This experiment was done as 6B but 30 nM siAgo2 was used instead of sip100. Results are shown as a mean of three independent experiments and SD. The mean value of each luciferase construct transfected together with siControl was set to one. Below are the representative western blots of Ago2 (upper panel) and β-tubulin (lower panel) expression. (D) The effect of Ago2 silencing on AT1R mRNA. COS-1 cells were transfected with 30 nM siAgo2 or equal amount of siControl. The cells were subjected to RNA extraction, followed by RT–PCR and quantitative AT1R-PCR. Results are shown as a mean of three independent experiments and SD. The mean mRNA value of siControl-transfected cells was set to one. The representative expression levels of Ago2 and β-tubulin in cell lysates are shown (lowest two panels).


