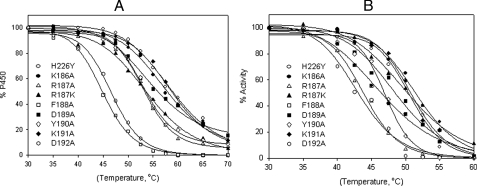
FIGURE 3.
A, thermal inactivation of CYP2B4dH mutants (1 μm) monitored by a decrease in the amount of total heme protein as a function of temperature as described under “Experimental Procedures.” Determination of the total concentration of the heme protein was done by non-linear least square approximation of the spectra by a linear combination of spectral standards of CYP2B4 low spin, high spin, and P420 states. The data were fit to a sigmoidal curve to obtain Tm. B, catalytic tolerance to temperature monitored by a decrease in the enzyme activity with 7-EFC as a function of temperature as described under “Experimental Procedures.” The data were fit to a sigmoidal curve to obtain T50.

