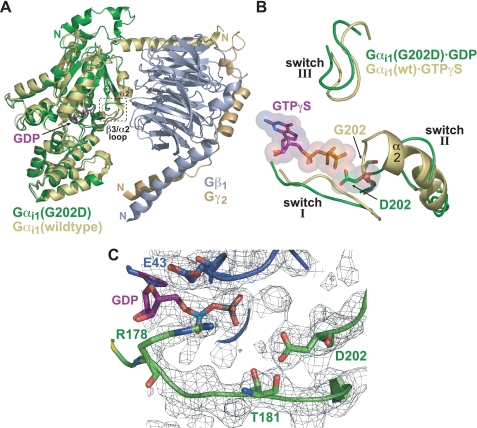
FIGURE 3.
Structural features of GDP-bound Gαi1(G202D) compared with GDP-bound and GTPγS-bound wild type Gαi1. A, superposition of GDP-bound Gαi1(G202D) (green) with wild type Gαi1·GDP/Gβ1γ2 heterotrimer (Gαi1 (yellow), Gβ1 (gray), Gγ2 (wheat); Protein Data Bank code 1GP2). Aside from the N-terminal helix, Gαi1(G202D) is largely unaltered compared with wild type. However, the β3/α2 loop containing the G202D mutation is displaced from the nucleotide-binding pocket relative to wild type, Gβγ-bound Gαi1. The partially ordered switch II region that proceeds from the β3/α2 loop does not assume the helical nature typical of Gβγ-bound and activated conformations of Gα. B, superposition of Gαi1(G202D)·GDP (green) and Gαi1·GTPγS (yellow; Protein Data Bank code 1AS0). Switch I and III regions are in a similar orientation; however, the orientations of switch II differ dramatically, most notably in the N-terminal portion (i.e. the β3/α2 loop). In wild type Gα, binding of GTPγS induces a rigid helical conformation in switch II (α2) that results in its movement toward the nucleotide-binding pocket. However, in the G202D mutant, switch II is deflected away from the nucleotide. Importantly, the Asp202 side chain demonstrates a significant steric and electrostatic clash with the γ-phosphate of the modeled GTPγS molecule. C, depiction of the GDP-binding pocket illustrating the orientation of the Asp202 side chain relative to GDP. Notably the acidic side chain of Asp202 is oriented directly toward the β-phosphate of GDP. Residues of switch I critical for GTP hydrolysis (Arg178 and Thr181) are shown along with Glu43 in the phosphate-binding loop region. The confidence of the structural model is highlighted by a 2Fo - Fc simulated annealing omit electron density map contoured at 1.0σ (gray mesh).

