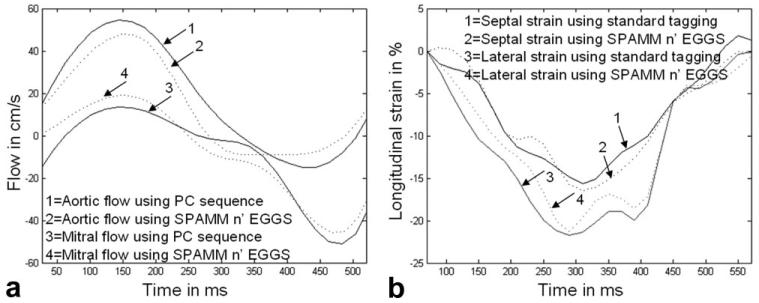
Figure 5.
a: Curves comparing the evolution of aortic and mitral flow averaged over a small region of interest obtained using SPAMM n' EGGS (see dotted line), and using standard phase contrast pulse sequence (see solid line). b: Curves comparing the evolution of longitudinal septal and lateral strain obtained using SPAMM n' EGGS (see dotted line), and using a standard tagging sequence (see solid line).

