
Figure 4.
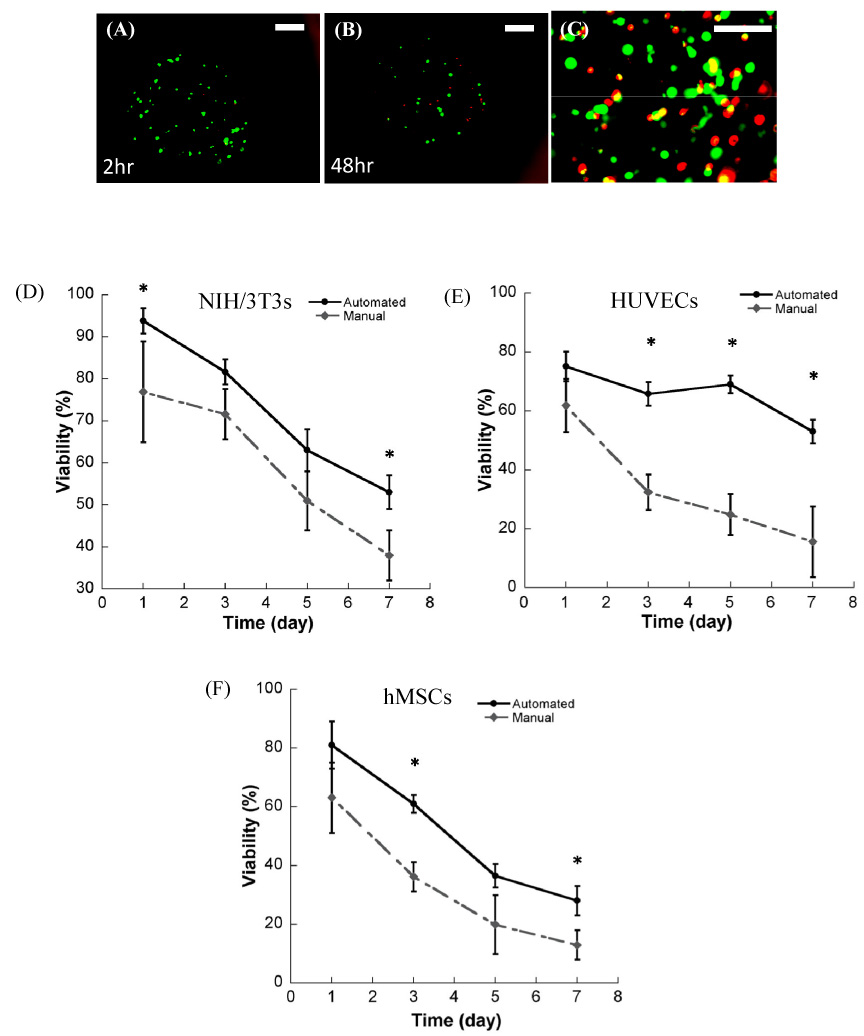
Representative images of NIH/3T3 cells incorporation into PEG hydrogel arrays A) 2 hours after encapsulation, and B) 48 hours after encapsulation. ((A) and (B) were taken at 40x magnification, scale bar = 100 µm). Representative image at higher magnification (100x magnification, scale bar = 50 µm) 2 hours after encapsulation. (D–F) Viability of three cell types in hydrogel arrays filled manually (by hand) and filled automatically (via a liquid handling robot) at 3 min UV exposure time at various time point; D) NIH/3T3 fibroblasts, E) HUVEC, and F) hMSC. (* Significant difference between manual and automated array processing methods within the same time points, p<0.05, t test).