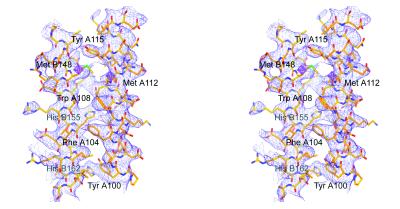
Figure 1.
Stereoview of the solvent-flattened, noncrystallographic symmetry-averaged experimental electron density map, contoured at 1.25σ at 4-Å resolution, with the current model depicted. Helices A4 (right) and B6 (left) of apo Δ(1–43)A-I are shown, as are two Pt sites (magenta octahedra). The Trp, Tyr, Phe, Met, and His residues of these helices are labeled.

