Figure 3. A: Effect of letrozole treatment at on the growth of LTLT-Ca xenografts after 4 months off letrozole.
LTLT-Ca xenografts were grown in female OVX nude mice as described in Materials and Methods. The mice were kept off letrozole treatment for a period of 4 months. After which they were grouped into two groups, shown as on and off letrozole. The mice in the control and letrozole treated group exhibited significantly different growth rate. The difference in the exponential parameter governing growth was 42.3, p = 0.04.
Figure 3B: Effect of letrozole on the tumor weight of the LTLT-Ca xenografts: The mean tumor weight of control mice was 607.5 ± 225.5 mg which was significantly different from those of the letrozole treated mice (112.5 ± 84.77 mg); p = 0.024. The graph shows mean ± SEM.
Figure 3C: Effect of letrozole on the uterine weight of the LTLT-Ca xenografts: The mean uterine weight of control mice was 83 ± 21.45 mg which was significantly different from those of the letrozole treated mice (39.67 ± 9.14 mg); p<0.01. The graph shows mean ± SEM.
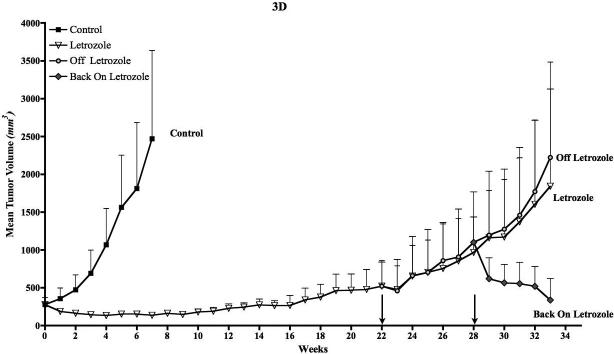
Figure 3D: Discontinuous treatment prolongs responsiveness of MCF-7Ca xenografts to letrozole: The tumors of MCF-7Ca cells were grown as described in materials and methods. The letrozole and off groups were sacrificed on week 34. The graph shows mean tumor volume ± SEM versus time (weeks).


