
Figure 4. A: Effect of letrozole on/off treatment the tumor weight of the MCF-7Ca xenografts.

The mean tumor weight of control mice was 1.38 ± 0.39 g, letrozole treated mice was 0.92 ± 0.36 g and off letrozole mice was 0.74 ± 0.34g. The graph shows mean ± SEM. The mean tumor weights were not significantly across the groups (p = 0.46).
Figure 4B: Effect of letrozole on/off treatment the uterus weight of the MCF-7Ca xenografts: The mean uterus weight of letrozole treated mice was 10.71 ± 1.658 mg which was significantly different from those of the control mice (50.67 ± 12.28 mg); p = 0.0006 (*a) and “off letrozole” mice (43.63 ± 13.44 mg); p = 0.02 (*b). The mean uterine weight of control and off letrozole mice was not significantly different (p = 1). The graph shows mean ± SEM.
Pearson correlation coefficient for uterine weight and tumors in letrozole group was −0.19 and 0.14 (left and right tumor respectively); p= 0.68 and 0.76- no correlation.
Pearson correlation coefficient for uterine weight and tumors in control group was 0.96 and 0.96 (left and right tumor respectively); p = 0.003 and 0.002 – very strong positive correlation is present.
Pearson correlation coefficient for uterine weight and tumors in off group was 0.95 and 0.84 (left and right tumor respectively); p= 0.0002 and 0.009– very strong positive correlation is present.
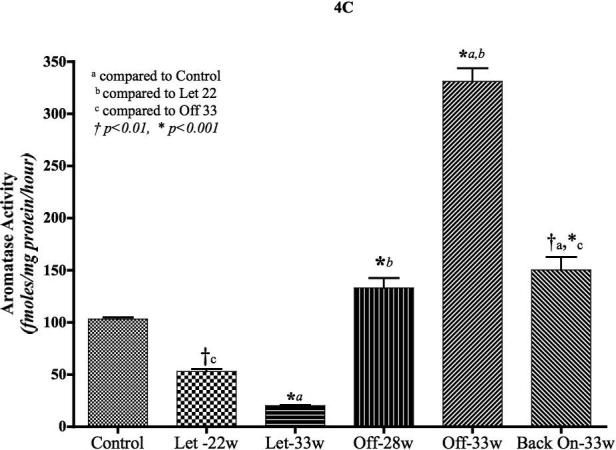
Figure 4C: Aromatase activity in the tumors of MCF-7Ca cells treated with letrozole: Aromatase activity was measured using 3H2O release assay as described in materials and methods. Control tumors were collected at week 7; letrozole treated tumors were collected at week 22 (when the group was split into on and off letrozole) and week 33 (when experiment was terminated); off letrozole tumors at week 28 (when group was split into off and back on letrozole) and week 33 (when experiment was terminated); back on letrozole at week 33. The graph represents mean ± SEM. One Way ANOVA with post-hoc Tukey multiple comparison test was performed to examine statistical significance.
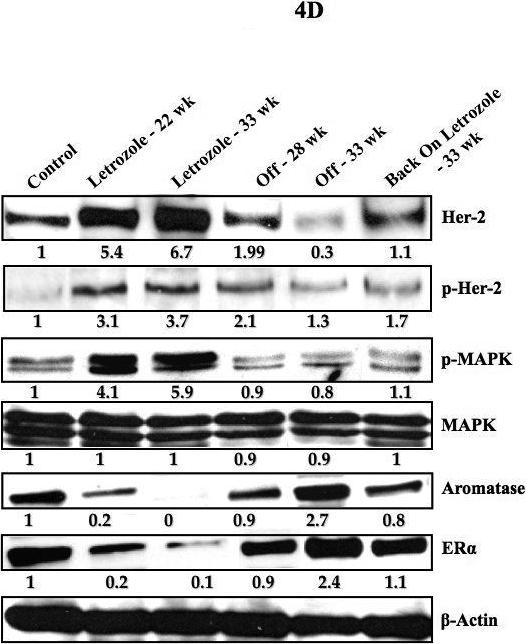
Figure 4D: Protein expression profile of the tumors of MCF-7Ca cells treated with letrozole: Expression of proteins was examined using western imunoblotting as described in Materials and Methods. Lane 1 Δ4A treated control, lane 2 letrozole treated tumor at week 22, lane 3 letrozole treated tumors at week 33, lane 4 tumor from “off” group at week 28, lane 5 “off” tumors at week 33 and lane 6 tumor from “back on” group at week 33. Blot shows Her-2 and p-Her-2 at 185 kDa, phospho-MAPK and MAPK at 42−44 kDa, aromatase at 55kDa, ERα at 66 kDa and β-actin at 45 kDa. The blots were stripped and re-probed for β-actin to verify equal loading. The blots show a single representative of three independent experiments.