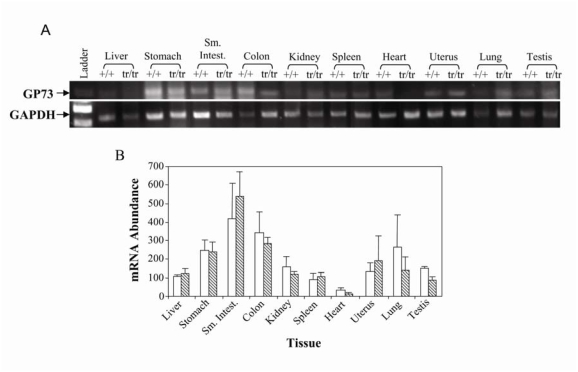
Figure 2.
GP73 mRNA expression in GP73+/+ and GP73tr/tr mouse tissues. A. RT-PCR of GP73 and GAPDH mRNA expression levels in indicated GP73+/+, and GP73tr/tr tissues. RT-PCR was performed using the E6/E7 primer set to amplify exons 6 and 7 common to both GP73+/+, and GP73tr/tr alleles. B. GAPDH-normalized band intensities of GP73 mRNA from GP73+/+ (open bars) and GP73tr/tr (hatched bars) mice.

