
Figure 2. HMM analysis of FRET data obtained from S6-Cy5/L9-Cy3 pre-translocation ribosomes.
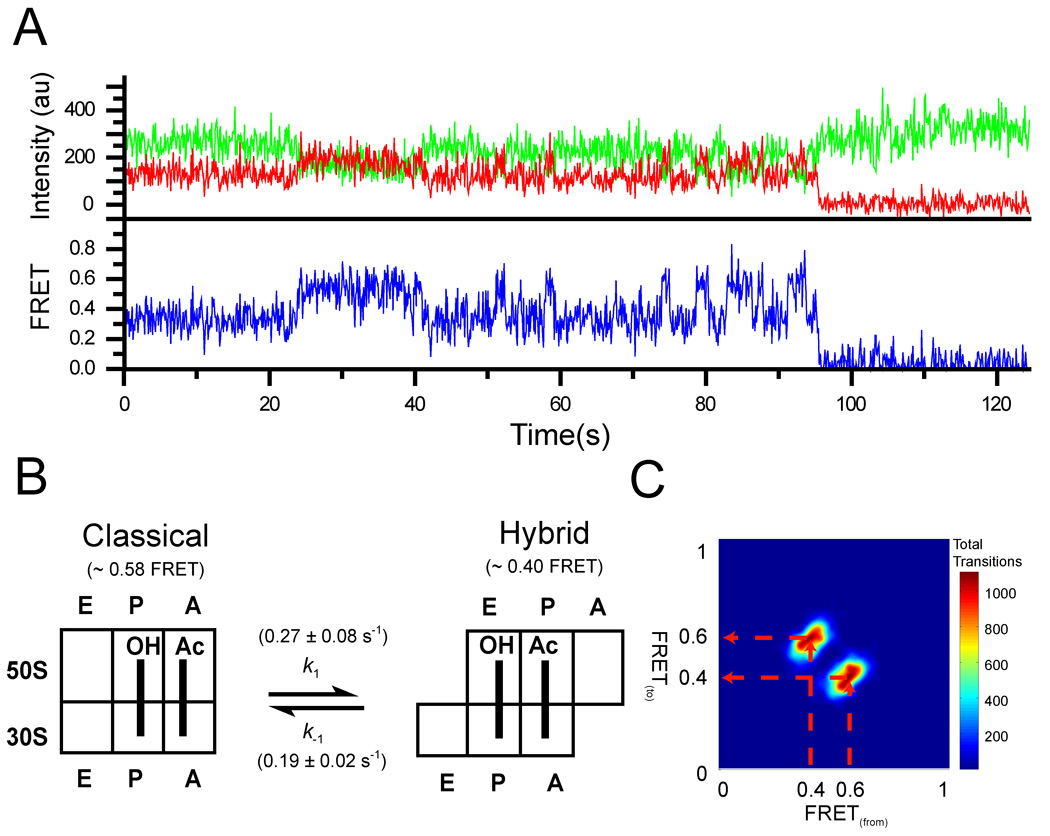
a. Representative trace showing fluorescence intensities observed for the Cy3 donor (green) attached to L9 and a Cy5 acceptor attached to S6 (red) in ribosomes containing tRNAfMet in the P site and N-Ac-Phe-tRNAPhe in the A site. b. Schematic showing the observed FRET values for the two states and the forward and reverse transition frequencies (k1 and k−1). c. Transition density plot (TDP) for the pre-translocation complex. The TDP is constructed by plotting values for each transition based upon the FRET value from which the transition originated (x-axis) and to which FRET value the transition ends (y-axis). The transition paths are indicated by the broken red arrows.