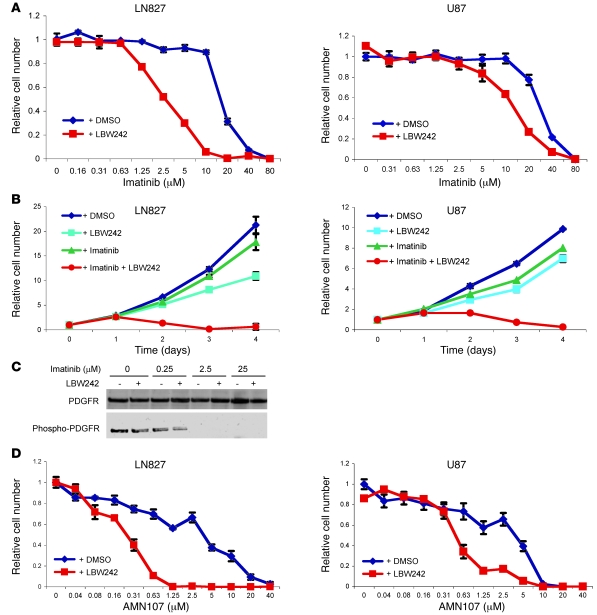
Figure 2. Synergistic effects of LBW242 and imatinib.
(A) U87 and LN827 cells were treated with the indicated concentrations of imatinib in combination with LBW242 (50 μM) or DMSO control. Cell numbers were determined 72 hours later via MTS. Data are expressed as mean ± SEM of triplicates. Similar results were observed in >3 independent experiments. (B) U87 and LN827 cells were seeded in 96-well plates and treated with LBW242 (50 μM), imatinib (8 μM), LBW242 plus imatinib, or DMSO control. The number of viable cells was measured via MTS assay after 24, 48, 72, and 96 hours. The data are expressed relative to the first day of treatment and are represented as the mean ± SEM of triplicates. (C) Serum-starved LN827 cells were treated for 90 minutes with dosages of imatinib and LBW242 as indicated. Levels of PDGFR and phospho-PDGFR were measured following immunoprecipitation and immunoblotting. (D) U87 and LN827 cells were seeded in 96-well plates and treated with the PDGFR inhibitor AMN107 at the dosages indicated in combination with LBW242 (50 μM) or DMSO control. Cellular proliferation was measured via MTS assay after 72 hours of incubation. Data are represented as the mean ± SEM or triplicates.

