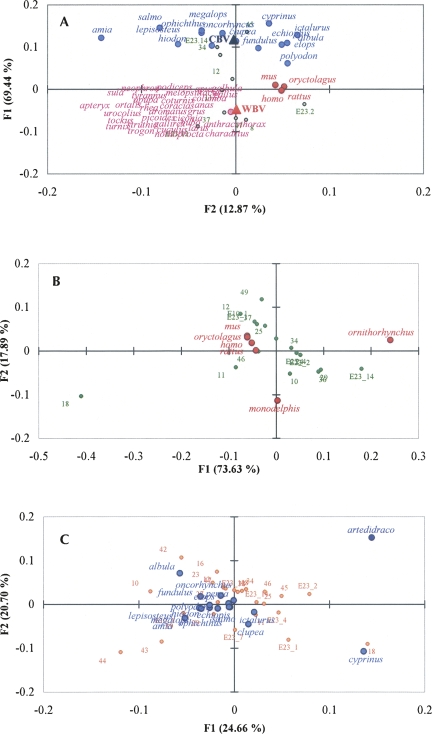
FIGURE 2.
Factorial plane representation of species according to the GC level of their stems. Distribution of the surveyed species as obtained in the factorial space (F1 and F2) by correspondence analysis. (A) Mammals (red points), birds (pink points), and ray-finned fishes (light-blue points) as listed in Figure 5. For species taxonomy, see Supplemental Table S1. WBV and CBV indicate warm- and cold-blooded as illustrative observations are indicated by a large red triangle and a large blue triangle, respectively. (B) Mammals (red points); (C) ray-finned fishes (light-blue points), polar fish (dark-blue point). In the figures, stems are presented in green (A,B) and orange (C).

