FIGURE 2.
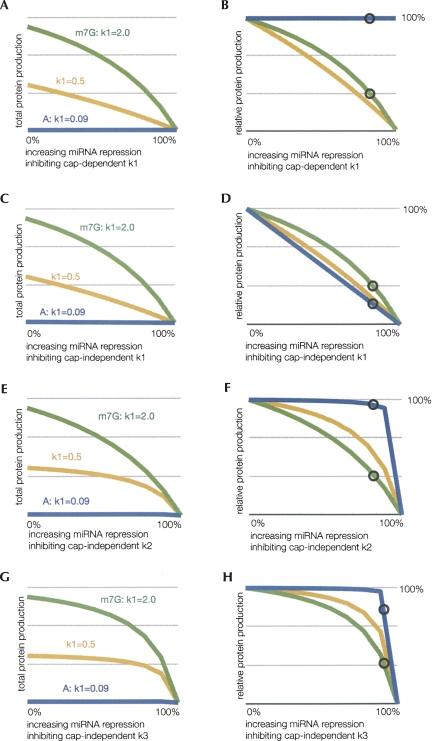
Effects of translational inhibition on individual steps of translation. These graphs depict the percentage of unrepressed protein production by altered rate constants and their effects for m7G-capped (m7G, green, k1 = 2), A-capped (A, blue, k1 = 0.09), and an intermediately translated mRNA (yellow, k1 = 0.5) for comparison. These modeled mRNA are identical except for the initiation complex formation rates (k1). Protein production refers to the percentage of unrepressed production for a respective k1 value. The region of rates inhibited by miRNA is from 0% to 100% repression of the respective values, where 100% repression results in no protein production. The circles indicate the observed in vitro miRNA-mediated inhibition in Mathonnet et al. (2007) with m7G-capped mRNA to allow comparisons to the amount of translation that will occur with mRNA having reduced k1 values. (A–B) Protein production from increasing repression of cap-dependent k1 shown as total and relative amounts, respectively. (C–D) Protein production from increasing repression of cap-independent k1 shown as total and relative amounts, respectively. (E–F) Protein production from increasing repression of k2 shown as total and relative amounts, respectively. (G–H) Protein production from increasing repression of k3 shown as total and relative amounts, respectively.

