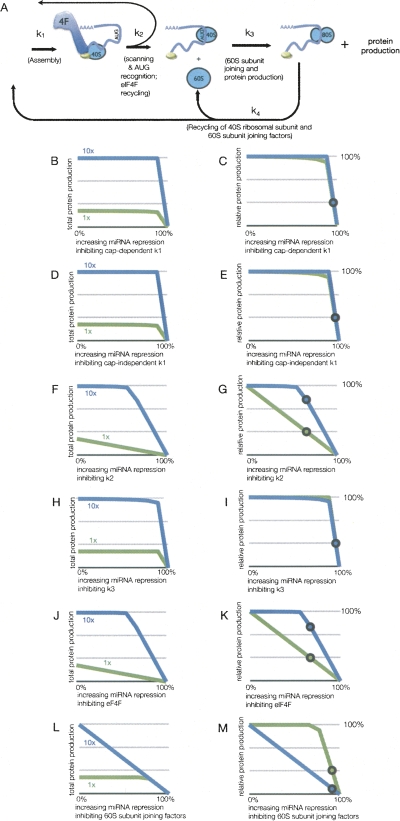
FIGURE 4.
Resistance of eIF4F enhanced translation to miRNA-mediated translational repression. (A) Depiction of the rates and species used for modeling translation incorporating eIF4F and 60S subunit joining factors. For panels B–M, the results of modeling potential sites of miRNA action on mRNA with standard (1×) or elevated (10×) amounts of eIF4F depicting protein production, with the percentage representing that versus unrepressed translation for each condition. The region of rates inhibited by miRNA is from 0% to 100% repression of the respective values, where 100% repression results in no protein production. The amount of eIF4F modeled is either the standard extract concentration (green, 1×) or 10-fold increased eIF4F (blue, 10×), which is indicated in the respective graphs. The circles on 1× lines indicate the observed in vitro miRNA-mediated inhibition of m7G mRNA with no additional eIF4F in Mathonnet et al. (2007). The circles on the 10× lines indicate the amount of translation if repressed equivalently to the mRNA with no additional eIF4F. (B–C) Protein production from increasing repression of cap-dependent k1 shown as total and relative amounts, respectively. (D–E) Protein production from increasing repression of cap-independent k1 shown as total and relative amounts, respectively. (F–G) Protein production from increasing repression of k2 shown as total and relative amounts, respectively. (H–I) Protein production from increasing repression of k3 shown as total and relative amounts, respectively. (J–K) Protein production from increasing repression of eIF4F shown as total and relative amounts, respectively. (L–M) Protein production from increasing repression of 60S subunit joining factors shown as total and relative amounts, respectively.

