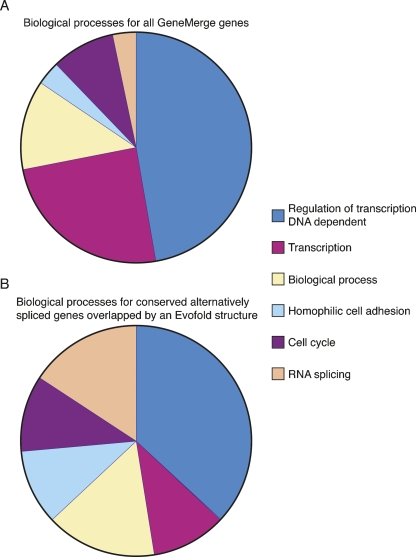
FIGURE 4.
GO ontology analysis of conserved alternative splicing events associated with Evofold structures. Using Supplemental Tables 1–3, a GO ontology analysis was performed for (A) all gene ontology entries and (B) all conserved alternative splicing events associated with an Evofold structure. Each data set was evaluated for the fractional representation of biological processes identified within the group of conserved alternative splicing events associated with an Evofold structure (B). Biological processes are color coded and are defined to the right of the graphs.

