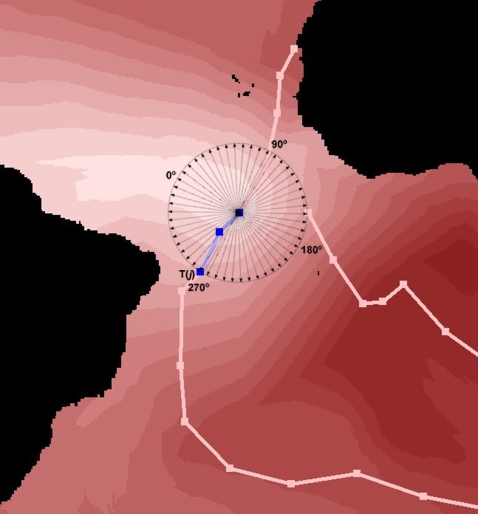
Figure 1. Calculation of the TDTs to test the hypothesis of no association between flight and minimum wind cost directions.
The blue segments represent a “two-day trajectory” (TDT). We set 50 points spaced at 7.2° (each defining a vector T(i)) on the circumference with a centre in the starting locality of the TDT and a radius corresponding to the total distance flight during the TDT. The value of 0° corresponds to the minimum wind cost trajectory. The vector T(j) approximates the flight heading, while the rest of vectors represent alternative trajectories not used by the bird. The background color represents the anisotropic wind cost for these TDT days (increasingly higher cost from light to dark saturation).

