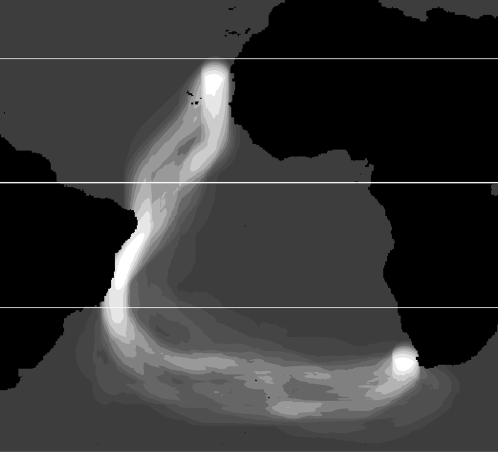
Figure 2. Minimum cost corridors calculated from SeaWinds data corresponding to the migration period of Cory's shearwaters (Nov., 9–30).
Increasingly lighter tones represent greater concentration of low-cost corridors (“wind highways”), while very dark tones represent lower concentrations of wind highways and, therefore, unlikely migratory routes between bird's breeding and wintering areas. The thicker line represents the Equator, and the thinner lines, the Tropic of Cancer and Capricorn.

