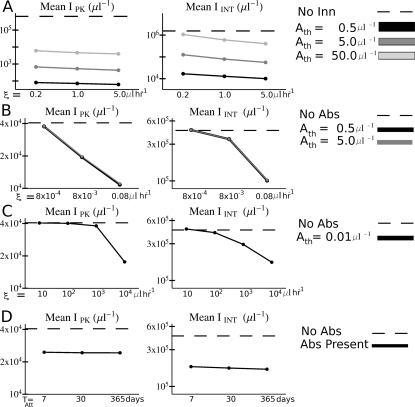
Figure 3. Overall variations in parasitemia with changes in the model immune parameters.
The host was antibody-naïve in all simulations. (A) Plot of the peak (I PK) and integrated (I INT) parasitemia averaged over all simulations (results for P. vivax and P. falciparum combined) with the corresponding values of target binding affinity ξ and antigen detection threshold A th for the innate responses. The dotted lines show the averages over simulations with no innate response. (B) Plot of I PK and I INT averaged over all simulations with the corresponding values of target binding affinity ξ and threshold trigger sensitivity A th for the antibody responses that do not target merozoites. (C) Plot of I PK and integrated IINT averaged over all simulations with the corresponding values of target binding affinity ξ for the antibody responses that target merozoites. (D) Plot of I PK and integrated I INT averaged over all simulations with the corresponding values of attacker decay time T Att for all antibody responses. In (B), (C), and (D), the dotted lines show the averages over all simulations with no antibody response. Note: In all panels, the vertical scale is logarithmic.

