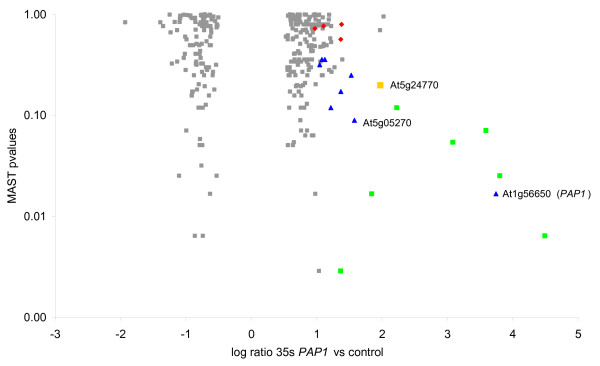
Figure 4.
Occurrence of the PAP1 cis-regulatory element in the top 300 microarray selected genes. A 3 kb promoter fragment for each of the top 300 genes was analysed for the presence of PCEs using MAST. The average fold change from all microarrays was compared with the P-value obtained from the MAST analysis. Genes highlighted in green represent those genes that have a PCE and were transactivated by PAP1. Blue represents those that have a putative PCE but not in the first 1 kb tested. Yellow represents a gene with a PCE in the first 1 kb but was not transactivated. Red represents genes with no PCE and not transactivated. Grey represents untested genes.

