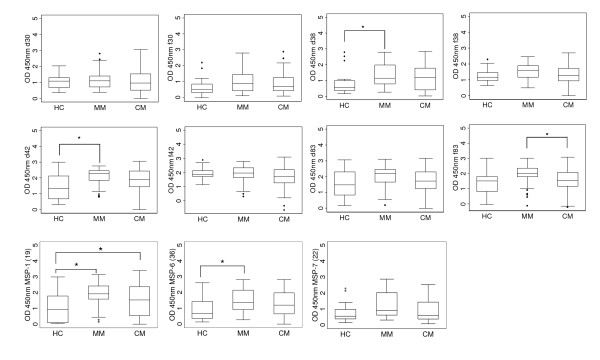
Figure 3.
Levels of total IgG antibody responses to MSP-1 subunits, MSP-636 and MSP-722 antigens. Total IgG antibody responses were measured. Box plots depict median values with 25th- and 75th-percentile values represented by the bottom and top edges of boxes. Small diamonds indicate values that fall outside of the error bars. Only a few antigens demonstrated statistically significant differences (* = p < 0.05) when the antibody levels were compared among the different disease categories. The different subunits and allelic forms of MSP-1 are represented as d30, f30, d38, f38, d42, f42, d83 and f83.

