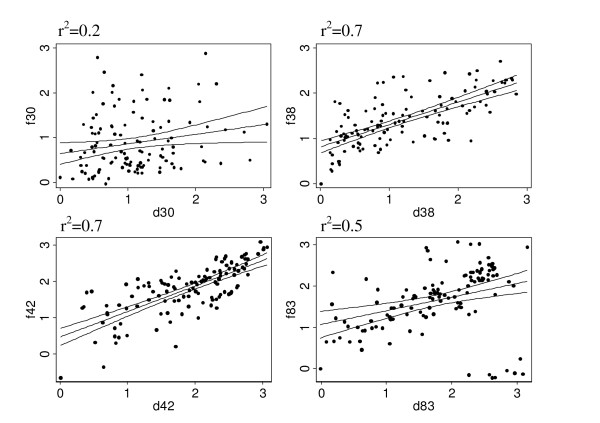
Figure 6.
Correlation of antibody responses between the two dimorphic alleles, MSP-1D and MSP-1F. To determine if there was a correlation in antibody responses between the two allelic forms of MSP-1, a scatter plot of anti-MSP-1D versus MSP-1F total IgG antibody responses was generated. The lines represent the fitted values and the 95% confident interval lines. The Spearman correlation coefficients are shown in the upper left corner.

