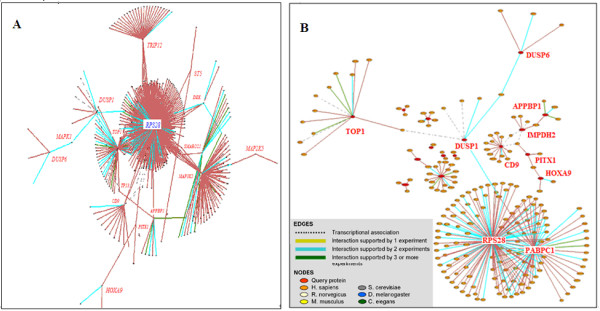
Figure 3.

Visualization of physical interactions and transcriptional associations of meta-A genes. (A) Global network involving the 23 meta-A genes labeled in red with the extended subnets centered on interaction input. (B) Close-up of two subnets of many input genes. For better viewing experience and more details, please see the Additional file 2.
