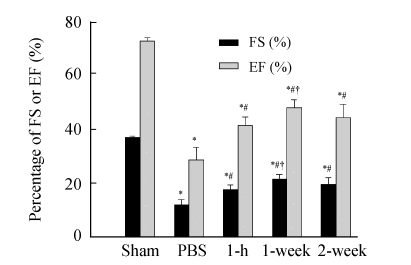
Fig. 2.
Comparison of cardiac function among 5 groups
FS: Fractional shortening; EF: Ejection fraction; Sham: Sham-operated rats without coronary ligation; PBS: MI rats that received PBS injection; 1-h, 1-week and 2-week: Rats receiving cell transplantation at 1 h, 1 week and 2 weeks post-MI, respectively. * P<0.01 vs Sham group; # P<0.01 vs PBS group; † P<0.05 vs 1-h and 2-week groups (n=10)

