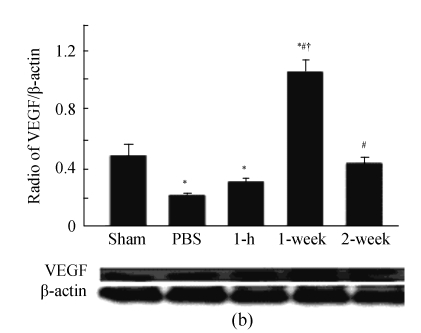
Fig. 5.
(a) Quantitative analysis of vessel density in peri-infarct area at 4 weeks post-MI (n=10). Vessel density was assessed in 5 randomly selected fields in each section and expressed as number of arterioles per unit area (0.2 mm2) (400× magnification); (b) Western blot analysis of the expression of VEGF (n=3). β-actin was the internal control. * P<0.05 vs Sham group; # P<0.05 vs PBS group; † P<0.05 vs 1-h and 2-week groups


