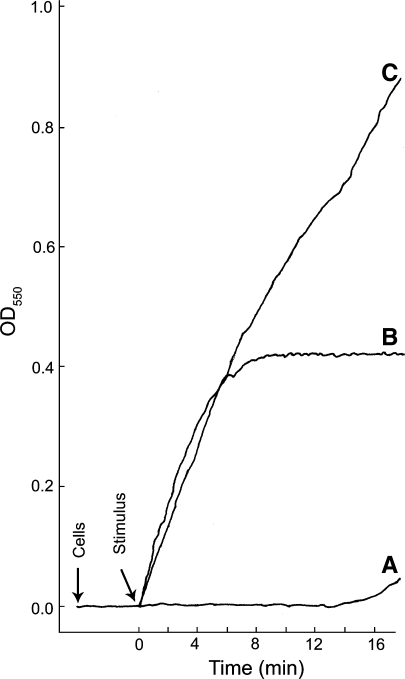
Fig. 1.
The levels of O-2 produced and the rate at which it is produced can vary depending upon the stimulus. Real-time kinetics of O−2 production by thioglycolate-elicited guinea pig neutrophils stimulated in three different ways is shown; the cytochrome c reduction spectrophotometric assay was employed. Representative curves of cells stimulated with either (A) NaF (12.5 mM) plus AlCl3 (100 μM), (B) the chemotatic peptide f-Met-Leu-Phe (10−7 M), or (C) a combination of f-Met-Leu-Phe and NaF plus AlCl3 at the same concentrations used in curves A and B. Cells (1 × 10⁶) were added and allowed to equilibrate at 37°C for 3 min before addition of the stimulus; during that time the resting cells did not generate O−2. Following the equilibration period, a stimulus was added (arrow). With NaF plus AlCl3 there was a long lag period prior to the release of modest amounts of O−2 (curve A). This lag period is likely due to the slow entry of the stimulus into the cells. The lag period was eliminated when cells were permeabilized by electroporation in the presence of NaF plus AlCl3 (Hartfield and Robinson 1990). When cells were stimulated with the chemotatic peptide, production of O−2 was essentially instantaneous and was largely shut down by 5 min post stimulation (curve B). When cells were stimulated by a combination of f-Met-Leu-Phe and NaF plus AlCl3, at the same concentrations used in curves A and B, the initial rate of O−2 production was essentially the same as that for the chemotatic peptide alone; however, the shut off of the f-Met-Leu-Phe stimulated O−2 was abrogated and the cells continued to produce O−2 at a high rate throughout the course of the incubation period. This experiment shows that: (1) resting neutrophils in suspension do not generate O−2; (2) activation of the NADPH oxidase and the production of O−2 can be very rapid in intact neutrophils; and (3) different stimulatory conditions can lead to different levels of O−2 production and the kinetics of O−2 production vary with different stimulatory conditions. The continuous spectrophotometric assay for O−2 production was as we have described previously (Robinson et al. 1987)

