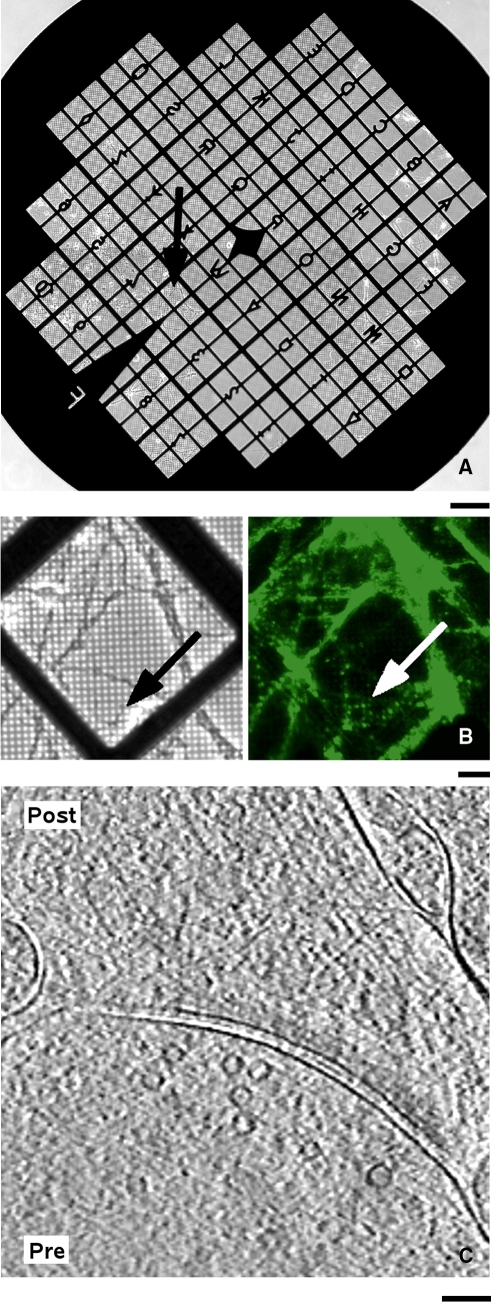
Fig. 3.
Application of LM and cryo-ET correlation on cultured neurons. a The whole grid imaged in phase-contrast LM. The arrow points to a grid square shown in b. Scale bar 200 μm. b Live phase contrast (left) and FM1-43 labeled cryo-fluorescence (right) images. The arrows point to the spot that was correlated to the image shown in c. Scale bar 20 μm. c Tomographic slices showing the correlated synapse. Presynaptic and postsynaptic terminals are labeled by “Pre” and “Post”, respectively. Scale bar 100 nm. (Modified from Lucic et al. 2007 with permission.)

