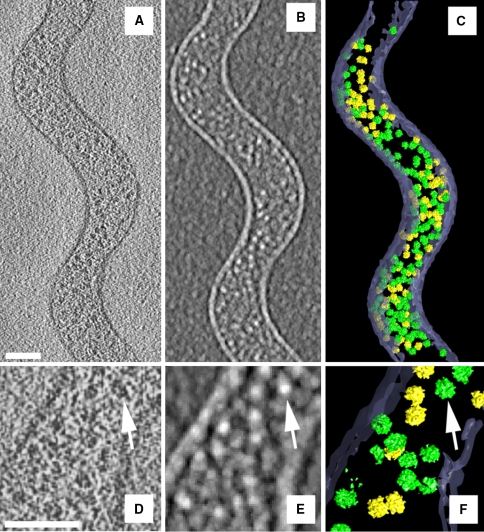
Fig. 5.
Identification by pattern recognition. Scale bars 100 nm. a, d Tomographic slice of an intact S. melliferum cell, b, e Pattern recognition using a 70S ribosome structure as a template, bright spots correspond to the detection peaks. c, f Final ribosome atlas after removal of putative false positives. Green denotes high, while yellow denotes medium detection fidelity. d–f Insets from (a–c). (Modified from Ortiz et al. 2006 with permission.)

