
Figure 1.
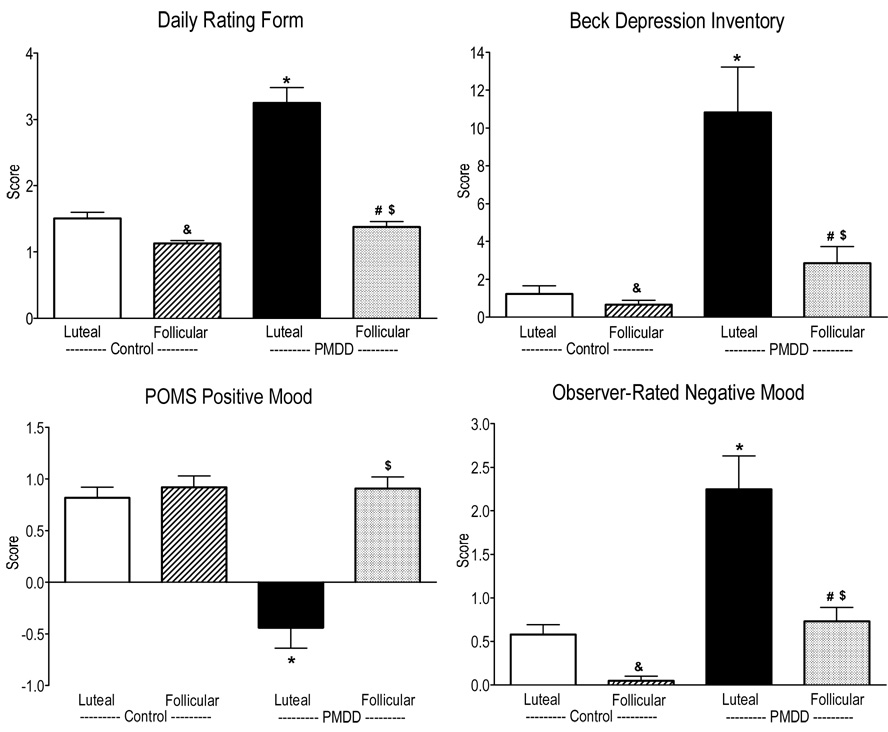
Scores on the Daily Ratings Form, the Beck Depression Inventory, POMS Positive Mood and Observer-Rated Negative Mood averaged over the sessions as a function of menstrual cycle phase and PMDD status. * denotes a significant difference between PMDD women in their luteal phase and Control women in their luteal phase (p ≤ 0.05). # denotes a significant difference between PMDD women in their follicular phase and Control women in their follicular phase (p ≤ 0.05). $ denotes a significant difference between PMDD women in their luteal phase compared to their follicular phase (p ≤ 0.05). & denotes a significant difference between Control women in their luteal phase compared to their follicular phase (p ≤ 0.05). Error bars represent 1 SEM.