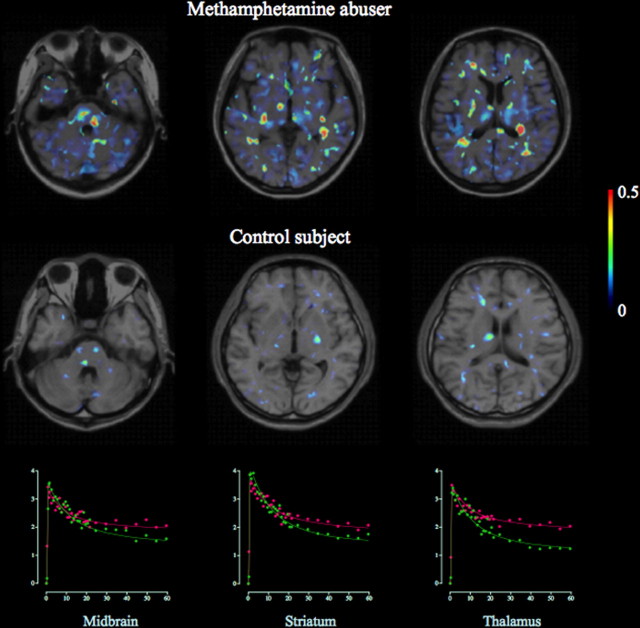
Figure 1.
Magnetic resonance imaging–positron emission tomography fusion parametric images of [11C](R)-PK11195 binding potential in a control subject and a methamphetamine abuser. A marked increase in [11C](R)-PK11195 binding was observed in widespread areas of the brain of the methamphetamine abuser. The color bar indicates a level of binding potential. Scattergrams show the time–activity curves of [11C](R)-PK11195 for each region in the methamphetamine abuser (red) and healthy control (green).

