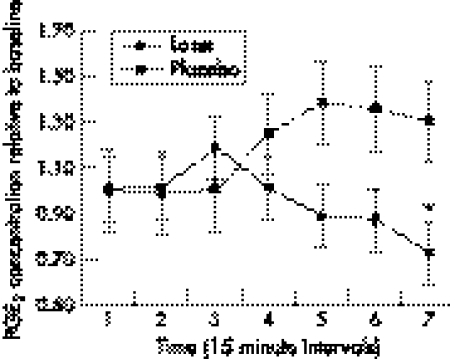
Figure 2 Laser effect on inflammation as measured by prostaglandin E2 (PGE2) concentrations in peritendinous tissue. Mean post‐treatment PGE2 concentrations and their respective 95% confidence intervals relative to the mean pre‐treatment baseline results are shown. Values were recorded at seven consecutive 15 minute intervals (total 165 minutes after treatment), and the significant between‐groups difference at the last time point is indicated by an asterisk.

An official website of the United States government
Here's how you know
Official websites use .gov
A
.gov website belongs to an official
government organization in the United States.
Secure .gov websites use HTTPS
A lock (
) or https:// means you've safely
connected to the .gov website. Share sensitive
information only on official, secure websites.
