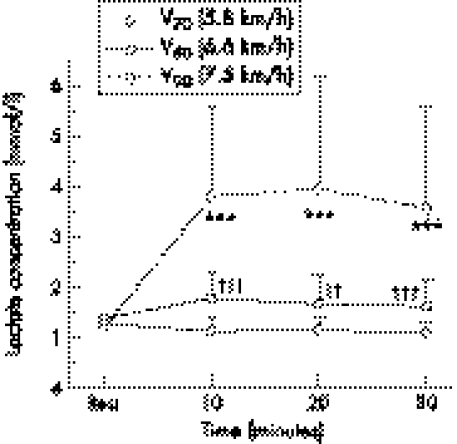
Figure 4 Lactate concentration during the 30 minute walking trials at 70%, 80%, and 90% of the maximal velocity obtained in the incremental treadmill walking test (V70, V80, and V90). Values are mean (SD) (n = 16). ***Significantly different from V80 and V70 (p<0.001), ††,††† significantly different from V70 (p<0.01, p<0.001 respectively).

An official website of the United States government
Here's how you know
Official websites use .gov
A
.gov website belongs to an official
government organization in the United States.
Secure .gov websites use HTTPS
A lock (
) or https:// means you've safely
connected to the .gov website. Share sensitive
information only on official, secure websites.
