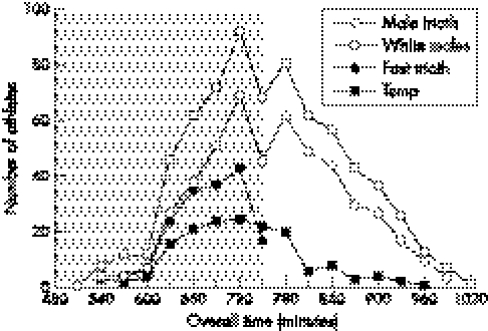
Figure 1 Comparison of the overall race time distribution of the whole field of male triathletes (Male Triath, n = 701) and the various subgroups of athletes who completed either the 2000 and/or the 2001 South African Ironman triathlon. A total of 115 male athletes completed both events, and the fastest times for these athletes were included in the analysis. The subgroups were the white male finishers (White Males, n = 488), the fastest finishers (Fast Triath, n = 169), and triathletes for whom post‐race rectal temperature data were available (Temp; n = 103 for the triathletes who completed the race in ⩽737 minutes and n = 54 for those who completed the race in >737 minutes). The Fast Triath athletes completed the events within the time period (737 minutes) indicated by the shaded area.

An official website of the United States government
Here's how you know
Official websites use .gov
A
.gov website belongs to an official
government organization in the United States.
Secure .gov websites use HTTPS
A lock (
) or https:// means you've safely
connected to the .gov website. Share sensitive
information only on official, secure websites.
