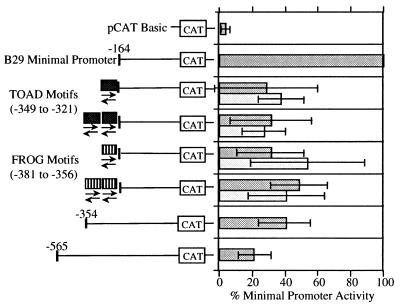
Figure 4.
Silencing activity in the B29 5′ gene regions corresponds to TOAD and FROG DNA binding motifs. Transient transfections to detect transcriptional expression of B29 promoter/silencer motif constructs were carried out in the M12 B cell line. The TOAD and FROG silencer motifs, positions −349 to −321 and −381 to −356, respectively, and their positions and orientations relative to the B29 minimal (−164) promoter are as indicated. The activity of each construct is expressed as a percentage of the CAT activity obtained with the B29 minimal (−164) promoter construct (100%). Deletion constructs −164, −354, and −565 are identified by nucleotide numbers with respect to the major start site of transcription (+1) and are shown for comparison.

