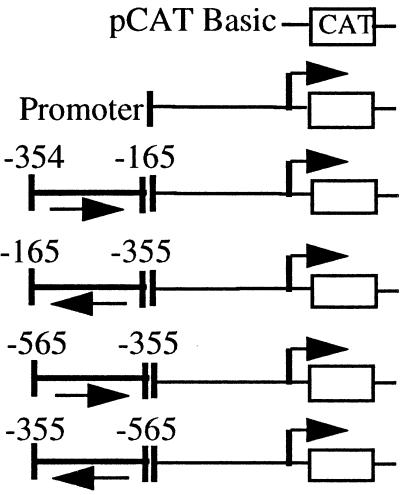
Table 1.
Silencer elements are neither promoter- nor cell-type-specific
| Construct generated with each promoter | % promoter activity
|
||||
|---|---|---|---|---|---|
| B cell
|
T cell
|
||||
| muB29 (−164) | huB29 (−193) | mb − 1 (−252) | c-fos (−71) | c-fos (−71) | |
| 8 ± 6 | 6 ± 3 | 13 ± 3 | 1 ± 2 | 4 ± 3 | |
| 100 | 100 | 100 | 100 | 100 | |
| 30 ± 14 | 41 ± 15 | 58 ± 13 | 42 ± 22 | 50 ± 29 | |
| 36 ± 17 | 83 ± 27 | 60 ± 23 | 52 ± 8 | ND | |
| 41 ± 8 | 42 ± 15 | 37 ± 6 | 34 ± 13 | 49 ± 29 | |
| 23 ± 7 | 110 ± 41 | 61 ± 14 | ND | ND | |
ND, not determined.

