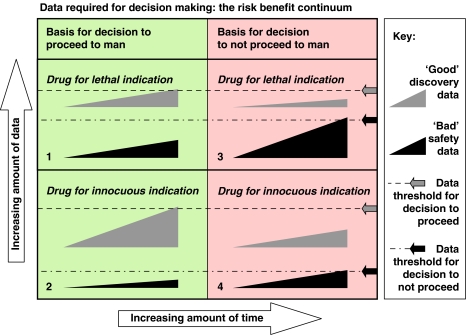
Figure 2.
Risk/benefit continuum. In this figure, the wedge symbols represent the accumulation of data for positive discovery outcomes and negative safety outcomes. At some point a decision needs to be made to proceed to human studies. This decision is taken when a subjective threshold is met (indicated by arrows and dotted lines). The decision is an integrated risk assessment. The amount of time required to reach the decision is arbitrary as it is the amount of information accumulated that is paramount. The extent data (discovery and safety) necessary and sufficient for a decision is a trade off. Thus, for a drug for a lethal indication, only a moderate amount of positive discovery data is necessary for a decision to proceed provided that a sufficient amount of worrisome (‘bad') safety pharmacology data has not accumulated (quadrant labelled ‘1'). If a threshold level of bad safety data has accumulated before the threshold amount of ‘good' discovery data is reached the drug will be killed (quadrant labelled ‘2'). The same rules apply for a drug for an innocuous indication, except that the threshold amount of necessary positive discovery data is greater (quadrant labelled ‘3'), while the threshold amount of bad safety data sufficient to kill the drug is much less (quadrant 4). This figure emphasizes the role of subjective judgement in decision making, and the influence of disease severity on the risk/benefit calculation.

