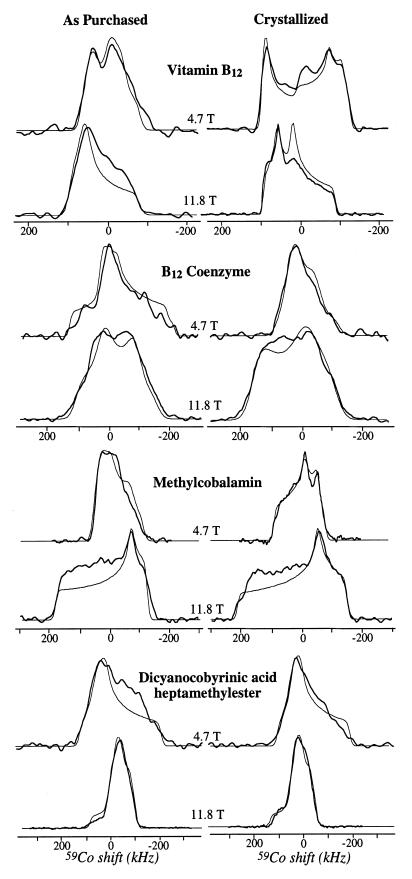
Figure 4.
Superimposed experimental (thick lines) and simulated (thin lines) 59Co solid-state NMR spectra corresponding to the indicated B12 derivatives. (Left) Spectra recorded on the samples as purchased. (Right) Spectra recorded on samples crystallized by slow evaporation. Line shapes were fitted at all magnetic fields simultaneously as described in the text, by using the coupling parameters summarized in Table 1.

