
Figure 3. Structural and functional abnormalities in the premotor cortex and underlying white matter in people who stutter.
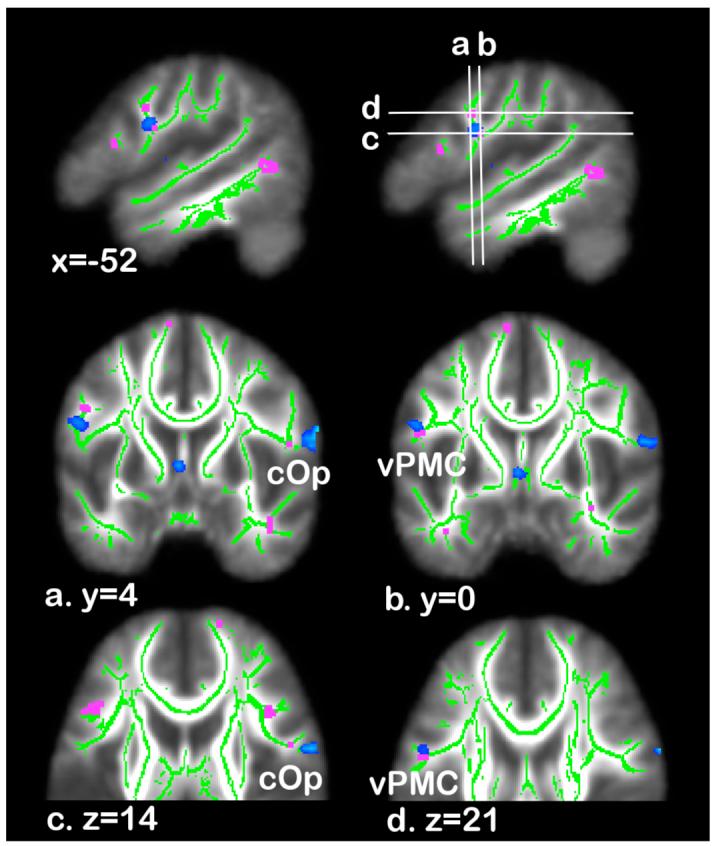
Functional and structural imaging differences between controls and PWS. The skeleton (green) is overlaid onto the average fractional anisotropy (FA) image of the subjects studied. Blue indicates areas where PWS had significantly less activity than controls during speech production, across the three feedback conditions (see Figure 1 for details). Pink indicates areas where PWS had lower FA than controls (see Figure 2 for details). Sagittal image in the top right of figure shows the position of the axial and coronal slices shown below (a.-d.). For axial and coronal slices the left side of the brain is shown on the left. vPMC - ventral premotor cortex; cOp - central operculum.