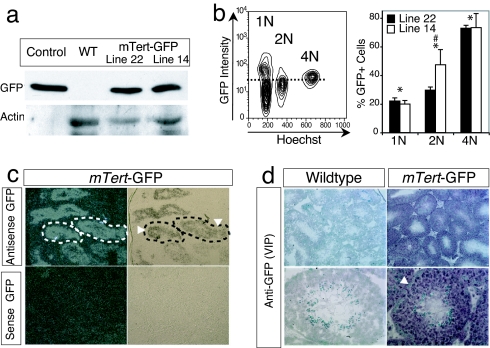
Fig. 2.
mTert-GFP expression in testis. (a) Western blotting was performed by using whole testis protein extract from WT, mTert-GFP, or Actin-GFP mice and rabbit anti-GFP antibody. The blot was stripped and reblotted by using anti-Actin antibody as a loading control. (b) Representative FACS analysis for GFP expression performed on single-cell isolates from seminiferous tubules of adult mTert-GFP and WT testes. Cells were gated into 1N, 2N, and 4N populations. The dashed line illustrates the GFP threshold as defined by WT control cells. Histogram represents the mean ± SEM from two independent experiments with 3–5 replicates; ANOVA, P < 0.001, post hoc Fisher's (PLSD) analysis revealed significant differences among (*) groups (1N, 2N, and 4N) for both lines and between (#) the 2N populations. (c) ISH for GFP expression in mTert-GFP adult testis. Dotted lines outline the seminiferous tubules. Arrowheads demarcate the basal layer of spermatogonial stem cells. (Left) Dark field images. (Right) Bright field images. (Magnification: ×10.) (d) Immunohistochemistry for GFP expression in mTert-GFP testis. Arrowhead indicates the basal layer of spermatogonial stem cells. (Magnification: Upper, ×10; Lower, ×40.)

