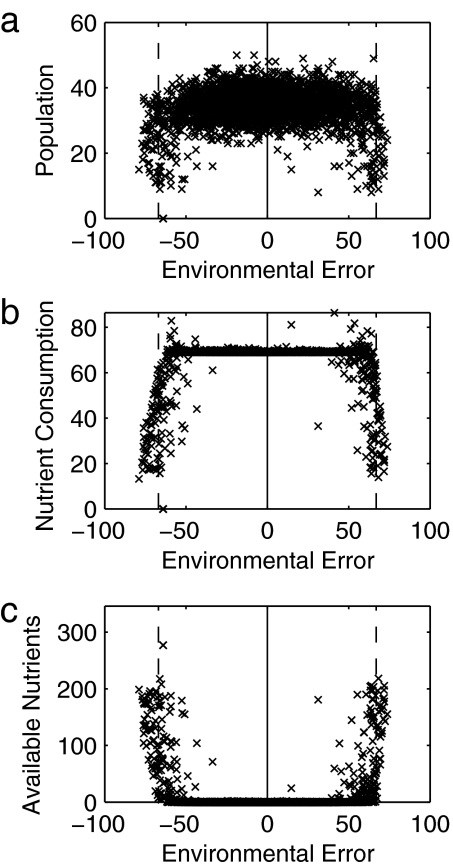
Fig. 3.
System behavior falls into two characteristic regimes depending on environmental error. Data are shown from the same example run as shown in Fig. 1. Different system metrics are scatter-plotted against environmental error over the course of the run: (a) population size; (b) nutrient-consumption rate (a proxy for productivity); (c) available nutrient levels in the environment. The solid vertical lines show the ideal abiotic conditions for growth (the zero-error state), and the dashed vertical lines show the boundaries of the habitable region. Within the habitable region, population size is typically at the carrying-capacity level determined by nutrient supply, consumption rates and growth are both high, and levels of stored nutrients in the environment are minimal. At (and outside) the boundaries of the habitable region, population sizes decrease, consumption/growth rates decrease, and nutrients build up in the environment.

