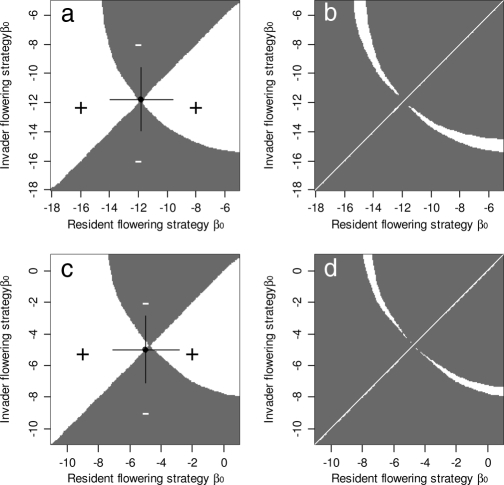
Fig. 1.
Graphical analysis of evolutionary dynamics. (a and c) Flowering strategy pairwise invasibility plots for Carlina (a) and Carduus (c). Shaded areas represent unsuccessful invasion of the resident strategy (x axis) by an invading strategy (y axis). The solid point and horizontal and vertical lines indicate the observed flowering intercepts and their 95% confidence intervals. (b and d) Graphs obtained by overlaying the pip with its mirror image. Areas in white represent areas of coexistence.

