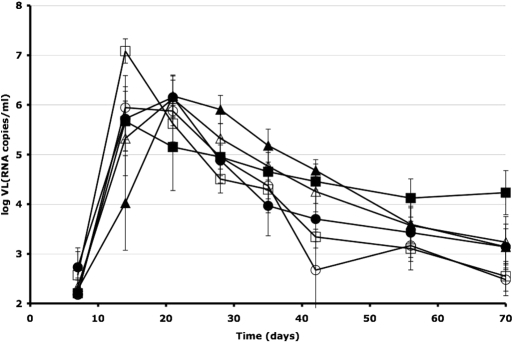
Fig. 2.
Mean viral loads in control macaques and nonprotected T-1249 recipients. The plasma viral loads (VL) of all of the infected animals described in Fig. 1 are plotted on the y axis as mean log(VL) (RNA copies per milliliter) ± SEM over time (x axis) for control (open symbols) and test animals that were not protected by T-1249 at the various test doses (filled symbols). The challenge viruses were SHIV-162P3 (circles), SHIV-89.6P (squares), and SHIV-KU1 (triangles). The numbers of animals in the groups were: SHIV-162P3, 3 controls and 5 T-1249-treated; SHIV-89.6P, 2 controls and 7 T-1249-treated; SHIV-KU1, 4 controls and 4 T-1249-treated. The AUCs did not differ between the control and T-1249 groups for any of the challenge viruses.

