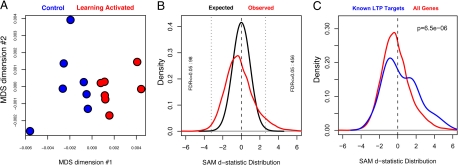
Fig. 2.
CA3 transcriptional profile. (A) A multidimensional scaling plot depicts the global similarity between RNA expression profiles across samples. This unsupervised (blind to group labels) dimension reducing visualization reveals separation of CTL (blue) and LA (red) groups. Quantitative comparison of the distances between points reveals that the between-group difference (the distance between the two group means) is greater than the within-group variance (the mean distance between individual samples within each group). (B) SAM d-statistic distribution of the observed LA-CTL comparison (red line) and chance (black line), generated by permuting group labels and recalculating differential expression statistics. Left and right vertical dotted lines indicate statistic thresholds beyond which FDR ≤0.05. Plot labels indicate the number of probesets defined in each hippocampal subregion that fall beyond these limits. (C) Genes known to have increased expression with LTP (literature defined list of 41 genes, blue line) are differentially expressed in CA3 (red line same as in B).

