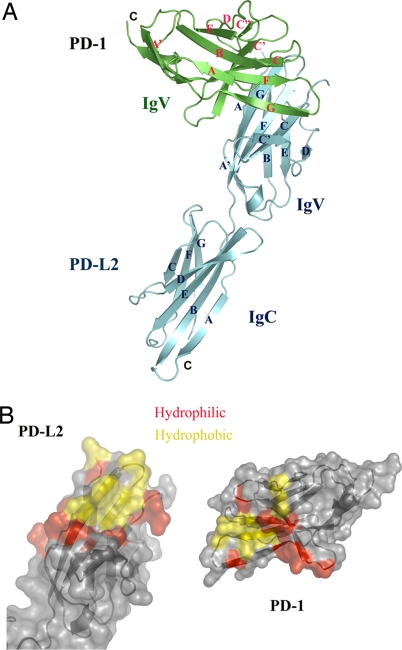
Fig. 1.
Structure of the PD-1/PD-L2 complex. (A) Overall structure of the PD-1/PD-L2 complex. Green, PD-1; cyan, PD-L2. The strands of PD-1 and PD-L2 are labeled in red and blue, respectively. (B) Surface representation of PD-1/PD-L2 binding interface. Red, hydrophilic residues in the binding interface; yellow, hydrophobic residues in the binding interface. PD-L2 is in the same orientation as in A; PD-1 is rotated 180° about a vertical axis to reveal the binding surface.

